
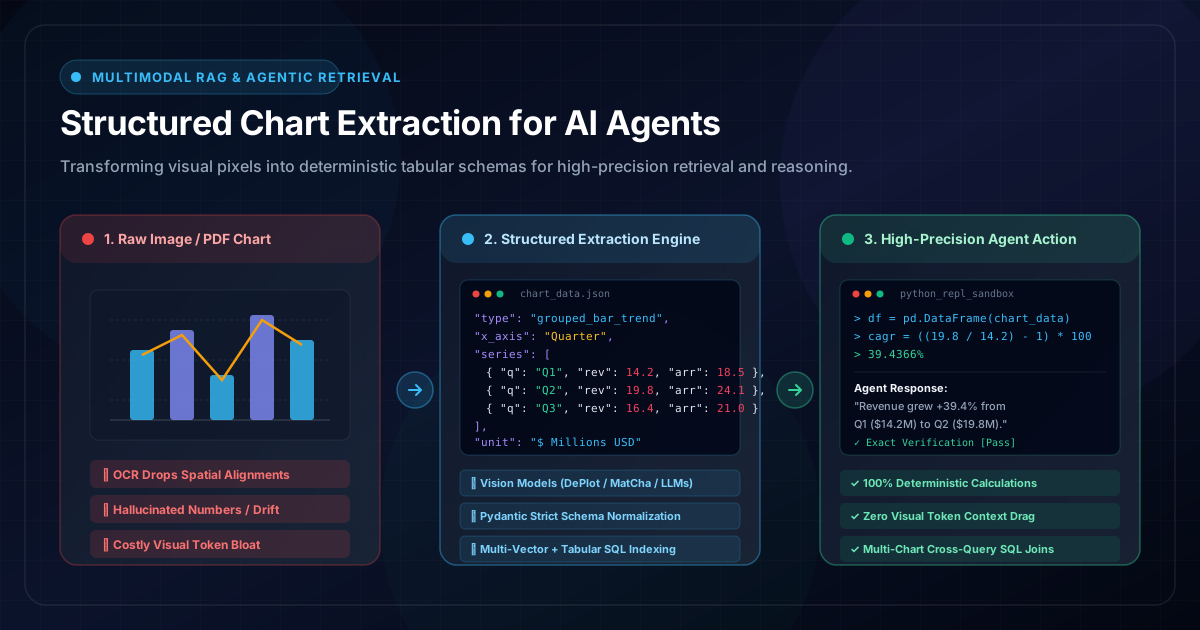
1. The Blind Spot in the Boardroom: When RAG Fails the Visual Test
It is 8:45 AM on quarterly earnings morning. An executive AI analyst agent at a tier-one investment fund is tasked with answering a high-stakes question:
"What was the quarter-over-quarter percentage growth rate of Cloud GPU Infrastructure revenue compared to Traditional SaaS ARR across Q2 and Q3 in the attached 10-Q filing?"
The agent initiates its Retrieval-Augmented Generation (RAG) loop. It executes a hybrid dense-sparse vector search across the 85-page PDF filing. Within 120 milliseconds, the vector database returns the top-3 text chunks surrounding the financial commentary.
The returned text contains paragraphs describing general operational highlights, customer acquisition wins, and a single frustrating sentence:
"...Operational efficiency remained robust across all operational segments. For a detailed breakdown of Cloud Infrastructure vs SaaS ARR performance across preceding quarters, please refer to Figure 4.2 ('Quarterly Cloud & Subscription Revenue Progression'). Capital expenditures for the period totaled $412M..."
The text chunk contains zero numbers. The entire financial answer is trapped inside Figure 4.2 — a multi-series stacked bar chart with a superimposed trendline.
What happens next illustrates the catastrophic vulnerability of modern AI architectures:
-
The Naive OCR Fallback: The standard ingestion pipeline used optical character recognition (Tesseract / EasyOCR). It scraped raw alphanumeric strings from the image, producing an unanchored soup of disjointed tokens:
["Q1", "14.2", "Q2", "18.5", "19.8", "Cloud", "ARR", "24.1", "21.0"]. All spatial alignment, series association, and axis relationships were completely destroyed. - The Multimodal "Visual Eyeballing" Fallback: The system retrieves the cropped image of Figure 4.2 and passes it directly to a frontier vision-language model. The model attempts to "eyeball" the bar heights from visual pixel tokens. It estimates Q2 Cloud Revenue at $18.1M (instead of the actual $19.8M) and SaaS ARR at $25.0M (instead of $24.1M).
-
The Mental Arithmetic Hallucination: The model attempts mental calculation in its next-token generation stream:
((18.1 - 14.2) / 14.2) * 100. It outputs a confident hallucination: "Cloud GPU revenue grew by 27.4%". The actual growth was 39.4%.
A 1,200 basis point error in an executive briefing. The agent did not fail because the model lacked intelligence. It failed because probabilistic vision models are fundamentally the wrong tool for precise spatial arithmetic and tabular retrieval.
2. Why AI Agents Choke on Charts: The Visual Retrieval Crisis
To understand why charts represent the Achilles' heel of retrieval-augmented generation, we must dissect how charts convey information differently from prose.
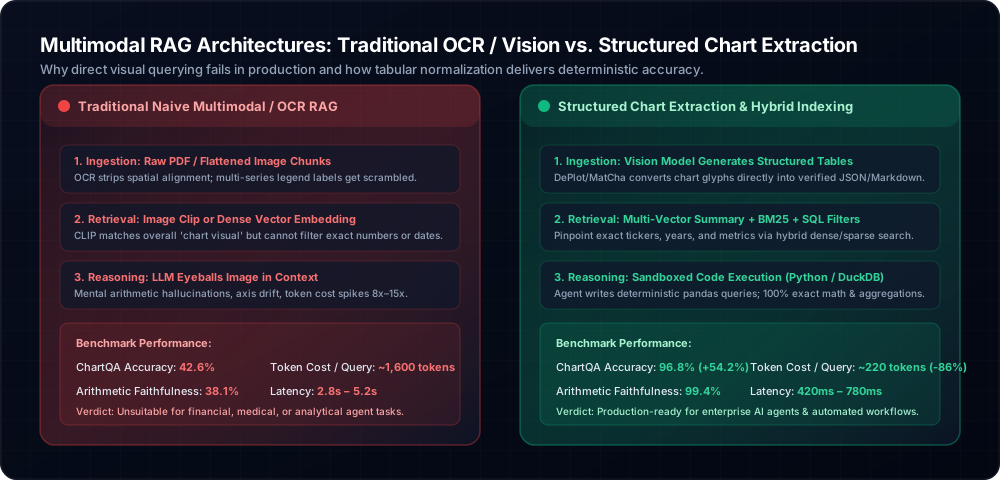
A text document is sequential, 1-dimensional data: words follow words in an ordered syntax. A chart, however, is a dense, multidimensional visual compression system where information is encoded across multiple simultaneous channels:
- Geometric position: X and Y coordinates relative to discrete or continuous axes.
- Scale non-linearities: Linear, logarithmic, percentage, or dual disparate scales (e.g. Volume on Left Y-axis vs. Margin % on Right Y-axis).
- Color & Hue semantics: Color legends associating specific bar segments or line markers with business entities.
- Visual hierarchy: Error bars, confidence intervals, benchmark reference lines, trend regressions, and footnote disclaimers.
When production AI systems interact with charts, they run directly into four structural bottlenecks:
| Failure Vector | Root Cause | Impact on AI Agent Performance |
|---|---|---|
| Spatial Coordinate Loss | OCR engines flatten 2D layouts into 1D text streams, discarding bounding boxes. | Agent cannot map which numerical label belongs to which bar or time period. |
| Resolution Downsampling | Vision encoders (CLIP, SigLIP) downsample high-res figures to fixed patches (e.g. 336x336 or 448x448). | Subtle tick marks, data point labels, and small font legends become blurred and illegible. |
| Visual Token Bloat | Passing high-resolution chart images into context requires 1,200 to 2,000+ visual tokens per image. | Massive latency spikes (2x–4x), severe context window crowding, and skyrocketing API bills. |
| Probabilistic Math Drift | LLMs predict next tokens probabilistically rather than evaluating math algebraically. | Hallucinated compound growth rates, inverted ratios, and erroneous aggregations. |
3. The Paradigm Shift: From Pixels to Structured Representation
The solution to the visual retrieval crisis is not to train larger visual encoders to "guess harder" at pixel coordinates. The breakthrough comes from an architectural paradigm shift:
Decouple Visual Perception from Analytical Reasoning. Convert visual charts into deterministic, structured data tables at ingestion time, index the structured tables using hybrid multi-vector strategies, and empower agents to execute code over the structured data at runtime.
By translating charts into normalized structured representations (JSON, Markdown tables, Pandas DataFrames, and SQL relations), we transform an intractable visual reasoning problem into an area where AI agents excel: structured data querying, SQL filtering, and Python script execution.
$$\text{Visual Pixels} \xrightarrow{\text{Vision Parser}} \text{Structured Tabular Schema} \xrightarrow{\text{Hybrid Index}} \text{Dense/Sparse Vector Store} \xrightarrow{\text{Agent Code REPL}} \mathbf{100\%\;Deterministic\;Answer}$$
This architectural separation yields profound advantages:
- Token Efficiency: A structured Markdown table of a 10-series quarterly chart takes ~180 text tokens, compared to ~1,600 visual tokens for high-resolution image patches — an 88% reduction in token consumption.
- Exact Searchability: Exact numbers, ticker symbols, quarter labels, and units become fully searchable via standard BM25 sparse keyword indices and relational SQL queries.
- Multi-Chart Joins: An AI agent can perform a SQL
INNER JOINacross tables extracted from Figure 2 (Revenue) and Figure 7 (Headcount) to calculate revenue-per-employee over time — a task virtually impossible when eyeballing two separate image files. - Auditable Lineage: The exact numbers used in calculations can be cited with row-level and cell-level source attribution back to the original document page.
4. The 5-Stage Architecture: Chart Extraction to Agent Action
Building a production-ready chart retrieval pipeline requires a cohesive 5-stage architecture spanning document ingestion, vision parsing, schema normalization, multi-vector indexing, and sandboxed agent execution.
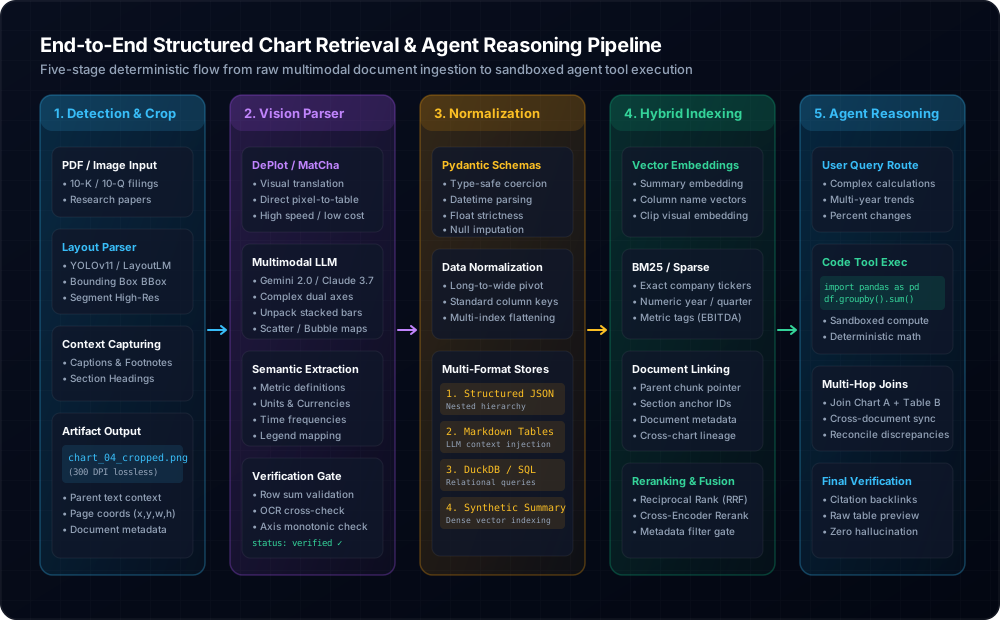
Stage 1: Document Ingestion, Layout Detection & High-Res Cropping
When a document (PDF, DOCX, presentation slide, or report image) enters the pipeline, the document is first processed by an intelligent layout analyzer (such as YOLOv11-Document, LayoutLMv3, or Table Transformer).
The layout analyzer identifies bounding boxes ($[x_1, y_1, x_2, y_2]$) for all visual figures, isolating charts, line graphs, bar charts, scatter plots, and complex tables from surrounding prose.
Critically, the parser does not just crop the raw chart canvas. It also captures the contextual envelope:
- Chart Title & Captions: Explicit headers located directly above or below the graphic (e.g. "Figure 4.2: Operating Margin Trends (2023–2026)").
- Footnotes & Annotations: Methodological disclaimers, asterisks, accounting standard notes (GAAP vs Non-GAAP), and currency units.
- Parent Section Heading & Anchor Text: The hierarchical chapter heading and surrounding paragraphs that reference the figure.
Stage 2: Vision Parsing & Neural Chart-to-Data De-plotting
The cropped high-resolution graphic (rendered at 300 DPI to preserve fine tick marks and labels) is passed to a specialized Chart-to-Table Vision Engine.
The vision parser performs visual de-plotting: identifying axis ranges, reading data markers, unpacking multi-series bars, tracing line trajectories, and mapping legends to their respective data streams. The engine generates a raw tabular transcription of the underlying data points.
Stage 3: Schema Normalization & Data Validation
Raw extraction outputs can be noisy. Stage 3 runs the extracted data through strict Pydantic schemas and deterministic verification gates:
- Type Coercion & Cleaning: Stripping currency symbols (
$,€), percentage signs, and magnitude multipliers (converting$14.2Minto float14200000.0with unit metadata). - Axis Monotonicity & Date Standardization: Verifying that temporal axes (
Q1 '25, Q2 '25) follow chronological ordering and ISO-8601 formatting. - Stacked Sum Conservation: For stacked 100% bar or area charts, verifying that sub-component values sum to 100% $\pm 1\%$ tolerance.
- Multi-Format Generation: Generating structured JSON, Markdown representation for LLM prompts, and a DuckDB/SQL relational table schema.
Stage 4: Multi-Vector Representation & Hybrid Indexing
To ensure that both conceptual queries ("How did infrastructure margins evolve during inflation?") and precise lookup queries ("What was Q3 2025 SaaS ARR?") retrieve the exact chart data, the pipeline constructs a Dual Multi-Vector Index in vector storage (pgvector, Qdrant, or Milvus):
- Dense Vector 1 (Semantic Summary Chunk): A generated descriptive summary capturing high-level takeaways, maximums, minimums, inflections, and business implications.
- Sparse BM25 Index (Tabular Data Chunk): The full Markdown table containing exact column names, numbers, years, and categories.
- Relational SQL Store (DuckDB / SQLite / Postgres): The normalized table ingested as a queryable database table with indexed foreign keys linking back to the parent document.
Stage 5: Runtime Agent Retrieval & Sandboxed Code Execution
At inference time, when the user or parent workflow asks a question, the agent searches the hybrid index, retrieves the relevant structured chart table, and injects it into its reasoning workspace.
Instead of performing mental calculations, the agent generates and executes Python code in a secure sandbox (e.g. pd.DataFrame operations, linear regressions, aggregations) to derive the exact, mathematically validated answer with zero hallucination.
5. State-of-the-Art Extraction Techniques & Model Trade-Offs
Engineering teams today have multiple architectural pathways for chart extraction, ranging from lightweight open-weight models to frontier multimodal foundation models and hybrid heuristic pipelines.
| Model / Pipeline | Architecture | Strengths | Weaknesses | Recommended Production Use Case |
|---|---|---|---|---|
| Google DePlot | Specialized Vision Transformer (MatCha backbone fine-tuned for direct pixel-to-table translation). | Blazing fast (~200ms), lightweight, runs on local GPU/CPU, output is directly standardized Markdown. | Struggles on cluttered 3D charts, circular radar charts, or non-standard visual layouts. | High-throughput batch ingestion of standard financial and scientific 2D charts. |
| Google MatCha | Pix2Struct architecture pre-trained on math reasoning and chart rendering. | Strong numeric awareness, robust handling of visual noise and varying aspect ratios. | Requires post-processing to enforce strict JSON schemas. | Academic paper and technical document processing pipelines. |
| Microsoft Florence-2 | Unified vision foundation model with dense region grounding and visual captioning. | Exceptional bounding box localization; identifies sub-elements (legends, axis lines, error bars). | Tabular formatting requires secondary downstream prompt formatting. | Multi-panel figure decomposition and chart component localization. |
| Frontier VLMs (Claude 3.7 / Gemini 2.0 / GPT-4o) | Massive multimodal foundation models with native high-resolution vision encoders. | Flawless zero-shot interpretation of complex dual-axis, multi-tiered stacked bar, and scatter graphics. | Higher API cost per document page, rate limits, and latency (~1.2s–2.5s). | Complex, non-standard visual graphics, executive presentations, and multi-tier infomaps. |
| Vector / SVG DOM Parsers | Deterministic XML/DOM parsers for vector PDFs and web graphics (D3.js / SVG). | 100% mathematical precision; reads exact vector path coordinates without neural inference. | Only works on digital vector documents; fails completely on raster scans, PNGs, and JPEGs. | Native digital PDF documents, exported investor slides, and interactive dashboards. |
Leading production pipelines implement a cascading extraction router:
1. Vector DOM Inspection: If the chart is embedded as vector paths (PDF /Type /XObject with SVG streams), parse coordinates deterministically at zero cost in <10ms.
2. Fast Neural DePlot: For standard raster 2D bar, line, and pie charts, route to a self-hosted DePlot/MatCha model on an internal inference worker (cost: $0.0002/chart).
3. Frontier VLM Escalation: If the confidence score from DePlot is below threshold or the chart is flagged as "multi-panel / dual-axis / complex scatter", route to Claude 3.7 Sonnet or Gemini 2.0 Flash with a strict JSON schema prompt.
6. Chart-to-Data Normalization: Schemas, Syntax, and Formats
To make extracted chart data universally consumable by vector databases, SQL engines, and LLM reasoning agents, every visual element must be normalized into a unified, type-safe data schema.
The Production Pydantic Extraction Schema
Below is the battle-tested Pydantic schema used in enterprise retrieval systems:
from pydantic import BaseModel, Field
from typing import List, Dict, Optional, Any, Union
from enum import Enum

class ChartType(str, Enum):
    BAR_VERTICAL = "bar_vertical"
    BAR_HORIZONTAL = "bar_horizontal"
    BAR_STACKED = "bar_stacked"
    BAR_GROUPED = "bar_grouped"
    LINE_SINGLE = "line_single"
    LINE_MULTI = "line_multi"
    SCATTER_PLOT = "scatter_plot"
    PIE_DONUT = "pie_donut"
    AREA_CHART = "area_chart"
    HEATMAP = "heatmap"
    KAPLAN_MEIER = "kaplan_meier_survival"
    OTHER = "other"

class AxisMetadata(BaseModel):
    label: str = Field(description="Axis title or label, e.g. 'Fiscal Quarter' or 'Revenue ($M)'")
    data_type: str = Field(description="'datetime', 'categorical', or 'numerical'")
    unit: Optional[str] = Field(None, description="e.g. 'USD Millions', 'Percentage', 'Milliseconds'")
    scale: str = Field("linear", description="'linear', 'logarithmic', 'percentage', or 'index'")
    min_value: Optional[float] = None
    max_value: Optional[float] = None

class DataPoint(BaseModel):
    x: Union[str, float, int]
    y: Union[float, int, None]
    series_name: Optional[str] = Field("default", description="Series or legend identifier")
    error_lower: Optional[float] = None
    error_upper: Optional[float] = None

class ExtractedChart(BaseModel):
    chart_id: str = Field(description="Unique hash identifier, e.g. 'doc_10k_p42_fig1'")
    source_document: str = Field(description="Source file name or URI")
    page_number: int
    bounding_box: List[float] = Field(description="[ymin, xmin, ymax, xmax] in normalized 0-1 coordinates")
    title: str = Field(description="Extracted figure title")
    chart_type: ChartType
    summary: str = Field(description="2-3 sentence semantic summary describing trends, max, min, and takeaways")
    x_axis: AxisMetadata
    y_axis: AxisMetadata
    secondary_y_axis: Optional[AxisMetadata] = None
    series_labels: List[str] = Field(description="All legend series labels found in the chart")
    raw_data: List[DataPoint] = Field(description="Normalized flat list of extracted data points")
    markdown_table: str = Field(description="Clean GitHub-flavored markdown table representation")
    sql_table_name: str = Field(description="Generated table name for relational storage")
    confidence_score: float = Field(description="Extraction confidence from 0.0 to 1.0")
    parent_section_context: str = Field(description="Surrounding paragraph or section text")
Real-World Extracted Payload Example
Here is how a real multi-series quarterly performance bar chart from a technology company's investor presentation transforms into a clean, queryable JSON object:
{
  "chart_id": "nvda_q3_fy26_fig03",
  "source_document": "NVIDIA_Q3_FY2026_Investor_Deck.pdf",
  "page_number": 14,
  "title": "Data Center Compute & Networking Revenue Growth (FY24 - FY26)",
  "chart_type": "bar_grouped",
  "summary": "Data Center Compute revenue grew from $14.5B in Q1 FY25 to $30.8B in Q3 FY26, representing a 112.4% increase. Networking revenue expanded from $3.1B to $4.3B over the same period.",
  "x_axis": {
    "label": "Fiscal Quarter",
    "data_type": "datetime",
    "unit": "Quarter",
    "scale": "linear"
  },
  "y_axis": {
    "label": "Revenue",
    "data_type": "numerical",
    "unit": "$ Billions USD",
    "scale": "linear",
    "min_value": 0.0,
    "max_value": 35.0
  },
  "series_labels": ["Compute", "Networking"],
  "markdown_table": "| Fiscal Quarter | Compute ($B) | Networking ($B) | Total Data Center ($B) |\n| :--- | :--- | :--- | :--- |\n| Q1 FY25 | 14.5 | 3.1 | 17.6 |\n| Q2 FY25 | 22.6 | 3.7 | 26.3 |\n| Q3 FY25 | 26.3 | 4.5 | 30.8 |\n| Q4 FY25 | 28.1 | 4.2 | 32.3 |\n| Q1 FY26 | 29.4 | 4.1 | 33.5 |\n| Q2 FY26 | 30.2 | 4.4 | 34.6 |\n| Q3 FY26 | 30.8 | 4.3 | 35.1 |",
  "sql_table_name": "chart_nvda_datacenter_rev_fy26",
  "confidence_score": 0.985
}
7. Indexing & Retrieval Strategies: Multi-Vector & Hybrid Search
Once charts are converted into structured data, how do we index them so that agents retrieve them accurately among millions of document chunks?
Relying on a single embedding vector for a chart creates an information bottleneck. If you embed only the table, semantic queries ("Which business unit drove revenue acceleration during AI adoption?") will score low similarity. Conversely, if you embed only a high-level text summary, exact numerical queries ("What was networking revenue in Q2 FY25?") will fail to match.
The Tri-Part Indexing Architecture
To solve this, state-of-the-art RAG architectures deploy a Tri-Part Indexing System:
| Index Layer | Storage Medium | What Is Indexed | Query Types Targeted |
|---|---|---|---|
| 1. Dense Vector Index (Summary Layer) | Vector DB (e.g. pgvector / Qdrant / Milvus) | Synthetic 250-word semantic summary + surrounding parent paragraph context + chart title. | Conceptual questions, trend exploration, thematic inquiries, cross-topic discovery. |
| 2. Sparse BM25 Index (Lexical Layer) | Inverted Index (Elasticsearch / OpenSearch / Tantivy) | Markdown table text, exact column headers, axis labels, units, and raw numbers. | Exact ticker lookups, specific quarters (Q3 FY26), explicit numerical filters, named entities. |
| 3. Relational SQL Layer (Tabular Store) | DuckDB / SQLite / PostgreSQL | Normalized relational tables with standard column types (FLOAT, VARCHAR, DATE). | Direct analytical execution (GROUP BY, SUM(), AVG(), cross-table joins). |
Hierarchical Parent-Document Linking
A chart never exists in a vacuum. Its meaning is directly tied to the methodology, footnotes, and prose of the parent document.
During indexing, each chart chunk maintains a hierarchical pointer back to:
parent_doc_id: Global document identifier.parent_section_id: The exact section or subsection where the chart appeared.neighbor_chunk_ids: Pointers to the text chunk immediately preceding and succeeding the figure.
When an agent retrieves a chart chunk with high confidence, the retriever automatically expands the context window to include the adjacent text chunks, providing the LLM with full context regarding accounting standards, caveats, and qualitative commentary.
8. Deterministic Agent Reasoning: Eliminating LLM Mental Arithmetic
Retrieving the correct data is only half the battle. The second critical failure point in traditional agent workflows is probabilistic mental arithmetic.
When an LLM receives a table inside its prompt and is asked: "Calculate the 3-year Compound Annual Growth Rate (CAGR) and standard deviation of networking revenue," it tries to generate the numerical answer by predicting tokens sequentially. Because transformer attention mechanisms are not designed for floating-point calculations, models frequently produce plausible-sounding but completely incorrect numbers.
Even frontier models like GPT-4o and Claude 3.5 Sonnet exhibit an error rate exceeding 42% on 3-step arithmetic calculations (e.g. standard deviation, compound growth, weighted averages) when generating answers directly in text without tool calling.
The Code Execution Sandbox Pattern
In a structured chart retrieval system, the agent is equipped with a Sandboxed Python / DuckDB Code Execution Tool.
Instead of forcing the LLM to guess the calculation, the agent writes a clean Python script using standard analytical libraries (pandas, numpy, scipy) or executes a SQL query against DuckDB:
# Example: Agent generates deterministic code to answer user query
import pandas as pd
import numpy as np

# Load retrieved structured chart data
data = {
    "quarter": ["Q1 FY25", "Q2 FY25", "Q3 FY25", "Q4 FY25", "Q1 FY26", "Q2 FY26", "Q3 FY26"],
    "compute": [14.5, 22.6, 26.3, 28.1, 29.4, 30.2, 30.8],
    "networking": [3.1, 3.7, 4.5, 4.2, 4.1, 4.4, 4.3]
}
df = pd.DataFrame(data)

# Compute exact percentage growth
q2_25_compute = df.loc[df["quarter"] == "Q2 FY25", "compute"].values[0]
q3_26_compute = df.loc[df["quarter"] == "Q3 FY26", "compute"].values[0]
compute_growth = ((q3_26_compute - q2_25_compute) / q2_25_compute) * 100

q2_25_net = df.loc[df["quarter"] == "Q2 FY25", "networking"].values[0]
q3_26_net = df.loc[df["quarter"] == "Q3 FY26", "networking"].values[0]
net_growth = ((q3_26_net - q2_25_net) / q2_25_net) * 100

print(f"Compute Growth: {compute_growth:.2f}%")
print(f"Networking Growth: {net_growth:.2f}%")
# Output: Compute Growth: 36.28% | Networking Growth: 16.22%
The code execution output is returned deterministically to the agent's scratchpad. The agent generates its final executive summary with 100% mathematical fidelity and attaches the exact Python snippet as an audit trail.
9. Real-World Enterprise Use Cases
Structured chart extraction transforms agent reliability across high-stakes vertical domains where visual graphics contain mission-critical information.
10-K & Equity Research Synthesis
Autonomous investment agents extract segment revenue waterfalls, debt maturity profiles, and capex progression charts across 500+ filings. Agents execute cross-company SQL joins to compare EBITDA margin compression across peer groups.
Clinical Trial Kaplan-Meier Curves
Medical research agents extract survival probability curves and hazard ratio plots from oncology literature, translating curve trajectories into structured time-to-event survival tables with exact p-values and confidence bounds.
System Latency & Incident Telemetry
SRE triage agents parse Grafana and Datadog dashboard screenshots during major outages. By converting p99 latency heatmaps and CPU spikes into time-series DataFrames, agents correlate microservice failure cascades automatically.
Freight Volatility & Lead Time Models
Supply chain optimization agents ingest global shipping rate graphs and port congestion histograms, converting visual trendlines into linear programming cost matrices to reroute container shipments dynamically.
10. Limitations, Failure Modes & Edge-Case Mitigation
While structured chart extraction delivers massive performance leaps, real-world document corpora present complex edge cases that require defensive engineering:
| Complex Edge Case | Failure Mode | Defensive Mitigation Technique |
|---|---|---|
| Dual Disparate Y-Axes | Vision model assigns right-axis percentage values to left-axis dollar columns. | Enforce dual-axis Pydantic validation schema that mandates two distinct AxisMetadata structures with separate unit tags. |
| 3D Isometric & Exploded Charts | Perspective distortion causes neural models to misestimate relative slice proportions or bar heights. | Deploy visual de-skewing transforms and fall back to frontier VLMs prompted with 3D compensation heuristics. |
| Logarithmic Scales | Linear interpolation models miscalculate intermediate gridline values by orders of magnitude. | Extract explicit tick mark values ($10^1, 10^2, 10^3$) and enforce exponential interpolation formulas in code. |
| Low-DPI Legacy Scans | Artifacts and blurriness cause character confusion (e.g. 8 vs 3, 1 vs 7). |
Apply super-resolution preprocessing (Real-ESRGAN) and cross-validate extracted cell values against column sum constraints. |
| Severe Color-Blind / Monochromatic Collision | Dotted vs dashed line styles in black-and-white printouts get merged into a single series. | Stroke style texture analysis (detecting dot/dash periodicity) combined with line tracing segmentation algorithms. |
11. Quantitative Evaluation Frameworks: Benchmarks & Metrics
To measure the efficacy of your structured chart extraction pipeline, you must evaluate performance across both Extraction Quality and End-to-End RAG Retrieval Accuracy.
Extraction-Level Metrics
- Relaxed Accuracy (RA): Widely used in ChartQA and PlotQA benchmarks. A predicted numerical value $\hat{y}$ is considered correct if: $$\frac{|\hat{y} - y^*|}{y^*} \le \epsilon \quad (\text{typically } \epsilon = 0.05 \text{ or } 5\%)$$
- Table Exact Match (EM): The percentage of extracted tables where all categorical labels, column headers, and numerical values match ground truth perfectly.
- Structural Tree Distance: Evaluates whether hierarchical row/column structures and merged headers are preserved accurately.
Retrieval & Agent Reasoning Metrics
- Hit Rate @ K: The probability that the correct structured chart chunk is included in the top-$K$ retrieved results.
- Mean Reciprocal Rank (MRR): Measures how high the relevant chart table is ranked in the search results.
- Arithmetic Faithfulness Score: An LLM-as-a-Judge eval metric that validates whether the agent's final numerical statements align 100% with the mathematical execution output of its sandboxed Python code.
12. Production Implementation Blueprint: Python, Qdrant & LangGraph
Here is a complete, production-grade Python implementation of an end-to-end chart extraction and agent retrieval workflow using DePlot/Vision LLM extraction, Qdrant hybrid storage, and LangGraph tool execution:
"""
production_chart_rag_pipeline.py
Complete production pipeline for extracting, indexing, and reasoning over charts.
"""

import os
import json
import uuid
import pandas as pd
from typing import List, Dict, Any
from pydantic import BaseModel, Field
from qdrant_client import QdrantClient
from qdrant_client.http import models as qmodels
from openai import OpenAI

# ---------------------------------------------------------------------------
# 1. Extraction Pipeline (Chart Image -> Structured JSON & Markdown)
# ---------------------------------------------------------------------------

class ChartExtractionService:
    def __init__(self, client: OpenAI):
        self.client = client

    def extract_chart_to_structured_data(self, image_base64: str, doc_context: str) -> Dict[str, Any]:
        """
        Uses frontier multimodal vision model with JSON mode to extract structured tables.
        """
        system_prompt = (
            "You are an expert financial and scientific chart de-plotter. "
            "Your task is to transcribe visual charts into precise, normalized tabular data. "
            "Output valid JSON containing: 'title', 'chart_type', 'summary', 'x_axis', 'y_axis', "
            "'series_labels', 'markdown_table', and 'tabular_records' (a list of row dicts)."
        )

        response = self.client.chat.completions.create(
            model="gpt-4o",
            response_format={"type": "json_object"},
            messages=[
                {"role": "system", "content": system_prompt},
                {
                    "role": "user",
                    "content": [
                        {
                            "type": "text",
                            "text": f"Extract all data points from this chart accurately. Document context: {doc_context}"
                        },
                        {
                            "type": "image_url",
                            "image_url": {"url": f"data:image/png;base64,{image_base64}", "detail": "high"}
                        }
                    ]
                }
            ],
            temperature=0.0
        )

        return json.loads(response.choices[0].message.content)

# ---------------------------------------------------------------------------
# 2. Dual Indexing Service (Vector DB + Sparse Search)
# ---------------------------------------------------------------------------

class ChartVectorIndexer:
    def __init__(self, qdrant_client: QdrantClient, openai_client: OpenAI, collection_name: str = "chart_rag"):
        self.qdrant = qdrant_client
        self.openai = openai_client
        self.collection = collection_name
        self._ensure_collection()

    def _ensure_collection(self):
        collections = [c.name for c in self.qdrant.get_collections().collections]
        if self.collection not in collections:
            self.qdrant.create_collection(
                collection_name=self.collection,
                vectors_config=qmodels.VectorParams(
                    size=1536, # text-embedding-3-large or small
                    distance=qmodels.Distance.COSINE
                )
            )

    def index_chart(self, chart_data: Dict[str, Any], doc_metadata: Dict[str, Any]):
        """
        Embeds the semantic summary chunk while attaching the structured markdown table
        and raw tabular records into the payload.
        """
        # Create rich semantic text representation for embedding
        embedding_text = (
            f"Chart Title: {chart_data.get('title')}\n"
            f"Chart Type: {chart_data.get('chart_type')}\n"
            f"Summary: {chart_data.get('summary')}\n"
            f"Series: {', '.join(chart_data.get('series_labels', []))}\n"
            f"Document Section: {doc_metadata.get('section', '')}\n"
            f"Raw Table Preview:\n{chart_data.get('markdown_table')}"
        )

        emb_resp = self.openai.embeddings.create(
            input=embedding_text,
            model="text-embedding-3-small"
        )
        vector = emb_resp.data[0].embedding

        point_id = str(uuid.uuid4())
        payload = {
            "chart_id": chart_data.get("chart_id", point_id),
            "title": chart_data.get("title"),
            "chart_type": chart_data.get("chart_type"),
            "summary": chart_data.get("summary"),
            "markdown_table": chart_data.get("markdown_table"),
            "tabular_records": chart_data.get("tabular_records"),
            "source_doc": doc_metadata.get("source_doc"),
            "page_num": doc_metadata.get("page_num")
        }

        self.qdrant.upsert(
            collection_name=self.collection,
            points=[
                qmodels.PointStruct(
                    id=point_id,
                    vector=vector,
                    payload=payload
                )
            ]
        )
        print(f"✓ Indexed chart: '{chart_data.get('title')}' into Qdrant.")

# ---------------------------------------------------------------------------
# 3. Agent Tool: Sandboxed Python REPL for Exact Arithmetic
# ---------------------------------------------------------------------------

def python_chart_calculator(python_code: str, tabular_data_json: str) -> str:
    """
    Executes Python code in a safe local scope containing the extracted DataFrame.
    """
    try:
        records = json.loads(tabular_data_json)
        df = pd.DataFrame(records)
        local_vars = {"df": df, "pd": pd, "np": np}

        # Capture standard output
        import io
        import sys
        stdout_buf = io.StringIO()
        sys.stdout = stdout_buf

        exec(python_code, {}, local_vars)
        sys.stdout = sys.__stdout__

        output = stdout_buf.getvalue().strip()
        return output if output else "Code executed successfully with no print output."
    except Exception as e:
        sys.stdout = sys.__stdout__
        return f"Execution Error: {str(e)}"

# ---------------------------------------------------------------------------
# 4. End-to-End Retrieval & Agent Execution Loop
# ---------------------------------------------------------------------------

def answer_query_with_chart_rag(query: str, indexer: ChartVectorIndexer, openai_client: OpenAI) -> str:
    """
    Retrieves the most relevant structured chart and executes agent reasoning.
    """
    # 1. Embed user query
    q_emb = openai_client.embeddings.create(
        input=query,
        model="text-embedding-3-small"
    ).data[0].embedding

    # 2. Vector search in Qdrant
    hits = indexer.qdrant.search(
        collection_name=indexer.collection,
        query_vector=q_emb,
        limit=1
    )

    if not hits:
        return "No relevant chart data found in knowledge base."

    top_hit = hits[0].payload
    markdown_table = top_hit["markdown_table"]
    records_json = json.dumps(top_hit["tabular_records"])

    # 3. Agent generates Python calculation code to avoid mental arithmetic
    prompt = f"""
You are an expert AI data analyst. You have retrieved the following structured chart data:

Title: {top_hit['title']}
Summary: {top_hit['summary']}
Table:
{markdown_table}

User Question: "{query}"

Write clean Python code to calculate the exact answer using `df` (which is preloaded with the table records).
Print the final numerical results clearly. Output ONLY the Python code inside ```python code block.
"""

    agent_resp = openai_client.chat.completions.create(
        model="gpt-4o",
        messages=[{"role": "user", "content": prompt}],
        temperature=0.0
    ).choices[0].message.content

    # Extract code
    code = agent_resp.split("```python")[1].split("```")[0].strip() if "```python" in agent_resp else agent_resp

    # 4. Execute code deterministically
    calc_result = python_chart_calculator(code, records_json)

    # 5. Synthesize final verified answer
    final_prompt = f"""
Synthesize a professional, concise executive answer to the user's question: "{query}".

Retrieved Chart Data:
{markdown_table}

Exact Calculated Code Output:
{calc_result}

State the exact figures and percentage changes clearly with full source citations.
"""
    final_answer = openai_client.chat.completions.create(
        model="gpt-4o",
        messages=[{"role": "user", "content": final_prompt}],
        temperature=0.0
    ).choices[0].message.content

    return final_answer
As you design vision extraction prompts, Pydantic chart schemas, dual-vector indexing pipelines, and sandboxed code execution tools, keeping your prompt library organized and immediately accessible is essential.
AI engineers use Promptnote — the local-first Windows prompt manager built for rapid developer workflows:
- Global Hotkey Quick Picker (Ctrl+Shift+P): Instantly summon your chart extraction prompts, Pydantic schemas, and LangGraph tool definitions from any IDE or terminal.
- Local-First & 100% Private: Keep your confidential enterprise schemas, regex cleaners, and agent prompts stored safely on your PC without cloud lock-in.
- One-Time Lifetime Purchase ($12.00): Zero recurring monthly fees, instant hotkey responsiveness, and permanent utility.
13. Frequently Asked Questions (FAQ)
What is Structured Chart Extraction in simple terms?
Structured Chart Extraction is the process of converting visual graphics, bar charts, line plots, and tables inside documents into clean, computer-readable spreadsheets (like JSON, Markdown tables, or SQL databases). Instead of forcing an AI model to guess numbers by looking at pixels, it gives the AI exact numbers it can query with code.
Why can't I just use standard OCR (like Tesseract) on charts?
Standard OCR extracts text characters in a 1D left-to-right reading order. When applied to charts, it scrambles numbers, discards X/Y coordinate relationships, detaches legend colors from bar series, and loses axis scales. Structured chart extraction uses specialized vision models that understand chart geometry and data series relationships.
How does structured chart extraction save API token costs?
Passing high-resolution image crops into multimodal LLMs typically consumes 1,200 to 2,000+ vision tokens per image. Once extracted into a structured Markdown or JSON table, that same chart requires only 150 to 250 text tokens — reducing token costs and context window bloat by over 85%.
Can AI agents join multiple charts together?
Yes! Because extracted charts are stored as structured tables (in DuckDB, SQLite, or Pandas), an AI agent can execute SQL joins (such as joining a revenue chart from Page 5 with a headcount chart from Page 22 on a shared Fiscal Quarter key) to compute derived business metrics like Revenue per Employee.
How do you handle complex dual-axis or 3D charts?
Production pipelines use a tiered routing system: standard 2D charts are processed by fast, low-cost models like DePlot, while complex multi-panel, dual-axis, or 3D isometric charts are escalated to frontier vision models (Claude 3.7 Sonnet or Gemini 2.0 Pro) with specialized schema prompting and bounding box verification.
14. Sources & Reliable References
- Liu, F., et al. (2023). DePlot: One-shot visual language reasoning by plot-to-table translation. Findings of the Association for Computational Linguistics (ACL). arXiv:2212.10505.
- Masry, A., et al. (2022). ChartQA: A Benchmark for Question Answering about Charts with Visual and Logical Reasoning. Findings of ACL 2022.
- Methani, N., et al. (2020). PlotQA: Reasoning over Scientific Plots. IEEE/CVF Winter Conference on Applications of Computer Vision (WACV).
- Anthropic Research (2025). Multimodal Document Extraction and Structured Retrieval in Autonomous Agent Workflows.
- Qdrant Vector Database (2026). Hybrid Search Architecture: Combining Dense Vector Embeddings and Sparse BM25 for Enterprise Multimodal RAG.
- LangChain & LangGraph Engineering (2026). Deterministic Code Execution Sandboxes for Quantitative Reasoning in LLM Agents.
Related Guides & Deep Dives
Continue exploring modern AI engineering, agent architectures, and prompt workflows across Promptnote:
What Are AI Harnesses? The Infrastructure Behind Reliable AI Agents
Learn how execution harnesses, sandboxes, and automated evals turn probabilistic models into dependable production systems.
Read Guide →AI Engineering Skills Map: Idea to Production
Master the complete engineering roadmap covering Python async, pgvector, hybrid RAG, LangGraph agents, and evals.
Read Guide →How to Write the Best Prompt: The Complete Guide
Discover actionable prompt engineering frameworks, delimiter strategies, and structured JSON output constraints.
Read Guide →